Key performance indicators (KPIs) are how eCommerce marketers tell if our efforts are working. They’re how we tell our bosses how well our efforts are working. They tell us where to adjust our bids, which ads are most effective, how to convert more browsers to buyers, and more. At the end of the day, eCommerce KPIs ultimately tell us how much we’re paying for a click and if we’re getting a good return.
In this post, we dissect the three eCommerce KPIs every eCommerce marketer needs to know — CPA, ROAS, and ACoS — and share our take on which KPI gives you the best insight.
Think you know all about eCommerce KPIs already? Jump straight to testing your knowledge in our quick eCommerce KPI quiz. If not, start reading.
Learn more about the right KPIs for your eCommerce business in the Rethinking eCommerce KPIs in 2021 webinar.
The Cost per Acquisition (CPA) eCommerce KPI
CPA, also known as cost per order (CPO), is the average cost you pay in exchange for a desired action. In the case of eCommerce, the action of a CPA (or CPO), is the “acquisition” of a customer in the form of an order placed on your website.
CPA is the measure of the average cost that goes into getting that order. An example is converting an impression on a shopping campaign ad to a click and actual order — a conversion. However, it ultimately ends when the item is in the shopping cart. If the user then abandons the cart, the click is still counted in your CPA.
While you can look at the CPA on an individual order, typically CPA is the average across all orders from a given ad or campaign. It doesn’t show the CPA for different bids over the life of the campaign, simply the aggregate average cost for advertised items placed in the cart.
How to Calculate CPA
CPA is calculated by dividing your cost to advertise by the number of acquisitions (or orders).
CPA = Total campaign cost / Total number of acquisitions
So, if you invest $2,000 to advertise keychains and you sell 100 keychains, your CPA is $20. CPA doesn’t show your revenue or profit, you’ll have to calculate those manually or use another KPI. CPA only shows you the average cost of each keychain sold with your advertising.
If you’re using any sort of analytics program or advertising management platform, you don’t have to calculate CPA yourself. Your program or platform does it for you.

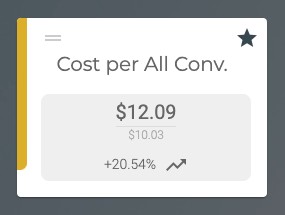
The Finch Advertising Management Platform shows CPA as Cost per All Conversions.
The Benefit of CPA
The benefit of CPA is that it’s only used when you make a sale. Since you pay nothing on a paid ad if no sale is made, using CPA as a KPI is an easy way to monitor and test ad effectiveness. A low or absent CPA means your ad is a dud.
The Problem with CPA
The main shortcoming of using CPA as a KPI is that it ignores the value of the item or service you’re selling.
For example, say you sell keychains. You spend $25 to make each keychain and sell each for $50.
If you advertise the keychains at a CPA of $500, you’re paying way too much for every keychain you sell. To break even on the keychain, your CPA can’t be any more than $25. And it needs to be lower than $25 to make a profit on each sale.
A more realistic use case is to set your CPA at perhaps $10 and make $15 for every one you sell.
And if you sell that keychain as part of a broad campaign, say for “car accessories,” your CPA is shared across anything that gets purchased — from items you sell for $50 to items you sell for $500. You end up without a clear picture of where to put your ad spend. (Learn about the benefits of a granular approach in “8 Benefits of Single Keyword Ad Groups.”)
To see revenue from your acquisitions, you want to use return on ad spend (ROAS) or advertising cost of sale (ACoS) as your KPI.
The Return on Ad Spend (ROAS) eCommerce KPI
ROAS is the KPI that tells you how much revenue you’re getting in return for each dollar you spend on advertising; in other words, your value per cost.
How to Calculate ROAS
ROAS is calculated by dividing the revenue from your campaign (or conversion value) by its cost. It’s shown as a number or percent.
ROAS = Campaign revenue / Campaign cost
In our earlier CPA example, your revenue is $50 per keychain. Say you promote the keychain in an ad campaign that you spend $1,000 on. You sell 200 keychains. You make $10,000 revenue (200 times $50). $10,000 divided by $1,000 equals 10.
Your ROAS is 10 or 1,000%. That means that for every dollar you spent you got $1 back, plus $9 more as well. You did well!
Note that revenue is not profit. On our keychains, our revenue per sale is $50. Each keychain cost $25 to make. So our profit is $25 ($50 sale price minus the $25 cost of making the keychain).
What ROAS you aim for depends not just on revenue, but on your gross margin, which is revenue minus your costs of goods expressed as a percentage. Higher gross margins mean you can afford a lower target ROAS (afford to spend more per sale) because you have more leeway before you become unprofitable.
The Benefit of ROAS
ROAS is always at least zero. Even if you lose money, you never lose revenue, you simply don’t make any revenue.
ROAS gives you a good way to compare platforms and channels. A ROAS of 5 on shopping campaigns compared to 1 or 2 on a paid search campaign is a fast way to see that you’re doing better — netting more revenue — from your spend on shopping ads. You quickly see that you should shift more budget to your shopping campaigns.
ROAS gives you a better picture of effectiveness than CPA too. Two ads, one that nets $500 in revenue and one that nets just $100 in revenue can have the same CPA if they have the same number of orders and ad spend. Looking only at CPA makes both ads look equally profitable.
If instead you calculate ROAS on the two campaigns, you see a higher ROAS on the ad that nets higher revenue. You get an immediate way to shift spend away from the campaign with lower ROAS to the campaign with higher ROAS.
The Problem with ROAS
Attribution and how you track it can affect and muddy ROAS as well as CPA and ACoS. No one attribution model or reporting solution lets you fully track the customer journey. If say, your buyer saw a display ad and later converted on a shopping campaign, ROAS doesn’t show you the display ads contribution to the actual purchase. Nor does ROAS divide the cost across both ads. Instead, it attributes the full ad cost to the last ad clicked. (Learn more in The Hidden Value of View-Thru Conversions.)
ROAS is also restricted by conversion lags (the delay between someone clicking an ad and converting). Google’s lookback window for conversions is 30 days. So any sales made longer than 30 days ago won’t be accounted for in your ROAS. Different platforms also have different lookback windows, which complicates calculating ROAS across platforms.
And like CPA, ROAS, as calculated by paid media reporting solutions, doesn’t account for costs of making your products or of doing business. Regardless, is a great way to track the effectiveness of your paid media efforts. So too is ACoS.
ROAS Is Not ROI
ROAS and ROI are related but not the same thing. ROI is a measure of the amount of additional profit produced by an investment. ROI is how much more or less you get in addition to your investment. An ROI of 400% is the same as a ROAS of 500%.
The Advertising Cost of Sale (ACoS) or Cost of Sales KPI
ACoS is also known as simply cost of sales (CoS). It’s a metric that helps you easily target higher revenue sales. It’s the opposite of ROAS in that it’s calculated by dividing the campaign cost by campaign revenue where ROAS divides revenue by cost. And while a higher ROAS is better, a lower ACoS is better.
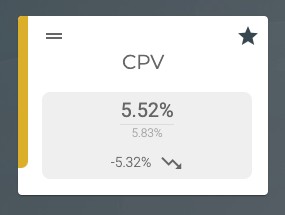
Note that where Google Ads reports ROAS by default, Amazon Advertising reports ACoS. Insights reporting in the Finch Advertising Management Platform reports ACoS as the cost per value (CPV) metric as well as ROAS. You can even choose which to show as your preference.
ACoS is shown as a percentage. An ACoS of 10% tells you that your costs use 10% of your sales revenue. So 10 cents of every $1 of revenue you earn goes to advertising costs; leaving you with 90 cents of revenue.
How to Calculate ACoS
ACoS is calculated by dividing the cost of your campaign by the revenue from your campaign.
ACoS = [Campaign cost / Campaign revenue] * 100
So, in the earlier keychain example:
- Your campaign cost is $1,000.
- Your revenue is $10,000.
- Your ACoS is 10%, meaning just 10 cents of every $1 you earn goes to advertising costs; leaving you with 90 cents of revenue.
You can quickly calculate ROAS from ACoS and vice versa:
ACoS = (1 / ROAS) * 100
ROAS = (1 / ACoS ) * 100

The Finch Insights in the FinchAdvertising Management Platform shows ACoS as CPV or (cost per value).
The Benefit of ACoS
ACoS is more convenient than ROAS as a cost-efficiency KPI because it shows you a clearer comparison of the ratio of your expense and return.
Looking at a ACoS of 27.5% clearly shows you how much you make on every dollar whereas the respective ROAS of 3.77 or 377% can be ambiguous. Regardless of which one you prefer, you can always easily switch between the metrics — ROAS and ACoS are inverses of each other. If you use the Finch Advertising Management Platform, you see ROAS and ACoS.

The Finch Insights lets you pick ACoS (CPV) or ROAS as your default revenue metric.
The Problem with ACoS
Because ACoS is the inverse of ROAS, it has the same potential shortcomings, attribution challenges, look-back window limitations, and lack of visibility into full costs as ROAS.
No reporting solution solves these challenges today. The only real way to circumvent them is to have a data science team at your disposal. Absent that, ACoS is an ideal metric to track your ad spend versus revenue. The lower your ACoS, the more you can tell your boss that you’re efficiently spending money to grow the business.
Learn more about the KPIs for your eCommerce business in the Rethinking eCommerce KPIs in 2021 webinar.
Test Your eCommerce KPIs Knowledge?
Take the quiz now.


